What have been the hottest housing markets in the United States over the last decade?
To answer this question, LendEDU analyzed data from the U.S. Census Bureau to track how median home values changed between 2010 and 2018 for nearly 800 areas and all 50 states, plus Washington D.C.
Our analysis also includes the places in the U.S. where home values have faltered since 2010. At the time of this writing, 2018 is the most up-to-date year that is included in the Census Bureau’s database.
Home values are a great economic indicator as they tend to rise and fall based on where high-paying jobs and industries are gravitating towards. Tracking home values over nearly a full decade can help us predict what cities and states are best positioned for ongoing economic success as we head into the next decade.
In this report, you will find the following:
Change in Home Values by City Over Nearly the Past Decade
The following table shows how home values have changed in 787 U.S. metropolitan or micropolitan statistical areas according to median home value data from the U.S. Census Bureau for both 2010 and 2018. To be included in this section, an area had to have median home value data for both years.
To find all the cities included from a specific state, you can either sort the table according to the state column or type the desired state’s abbreviation into the search bar.

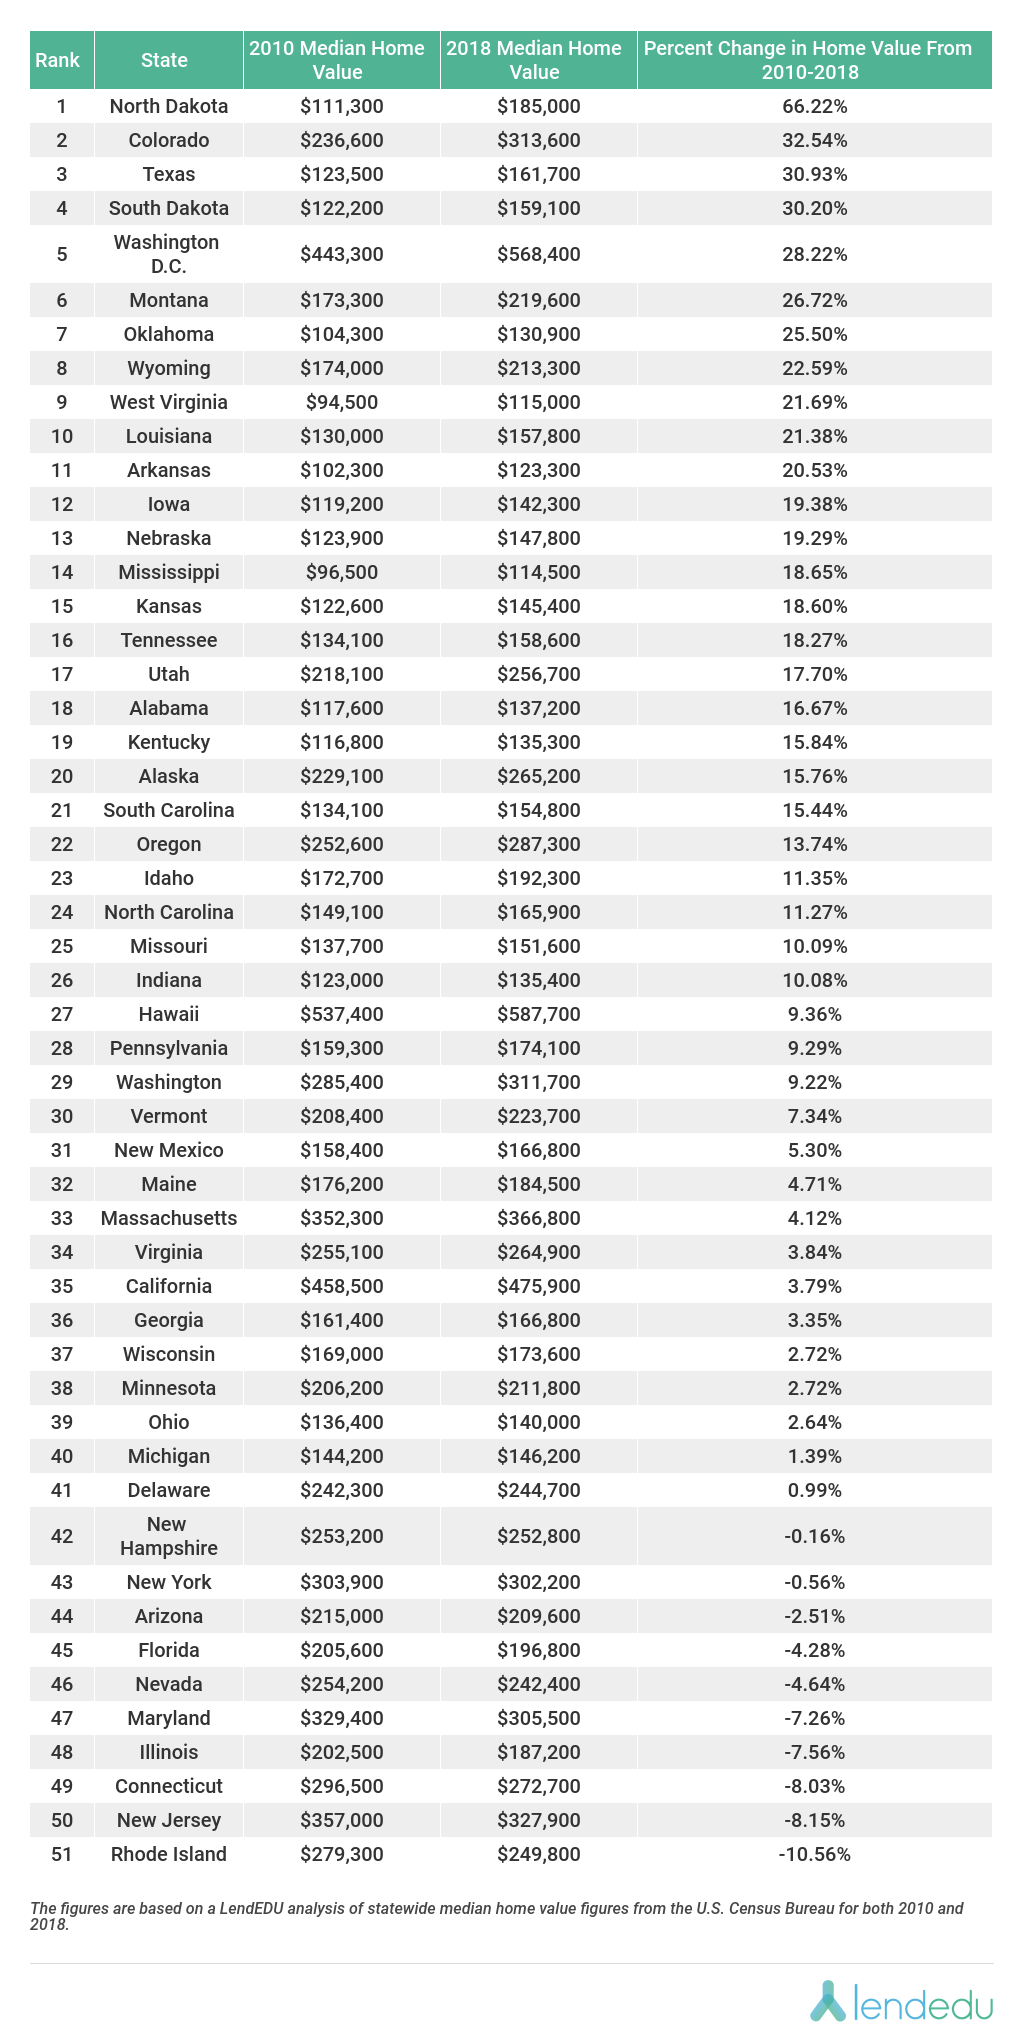
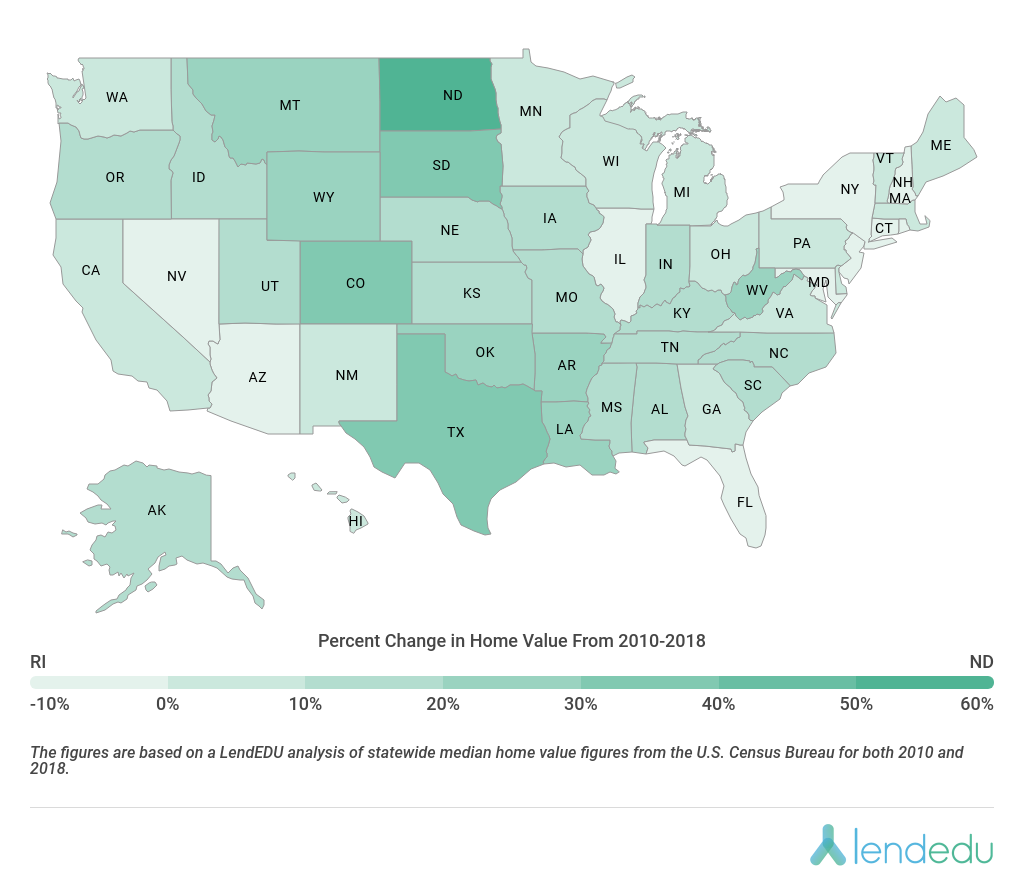
Change in Home Values by State Over Nearly the Past Decade
The following table and map both feature the same analysis that tracked how home values have changed in all 50 states and Washington D.C. according to statewide median home value data from the U.S. Census Bureau for both 2010 and 2018.
As a Table
As a Map
Methodology
All data in this report derives from the U.S. Census Bureau. The median home value for each state and Washington D.C., in addition to the median home value for each metropolitan and micropolitan statistical area in the U.S., was pulled to complete the analysis. To be included in the report, each area had to have median home value data from both 2010 and 2018. Once the data for each place from each year was matched, a percent change equation was run to find the percent change in home value for each place from 2010 to 2018.
See more of LendEDU’s Research
About our contributors
-
 Written by Mike Brown
Mike Brown uses data from surveys and publicly available resources to identify emerging personal finance trends and tell unique stories.