Wherever the money goes, the people are not far behind.
This trend can be traced back all the way to when the United States was only known as the New World, and colonists from all over Europe rushed across the Atlantic Ocean on the promise of economic opportunity on the newly discovered continent.
Or, in the mid-1800’s when over 300,000 people from the U.S. and abroad traveled west to California to get a piece of the gold rush.
When oil was discovered in Texas in the early 20th century, the state became flush with people, businesses, and cash.
More recently, Silicon Valley saw explosive economic growth because of the boom and subsequent rise of the tech industry. Even more recently, the areas surrounding North Dakota have become economic boom towns following the discovery of oil.
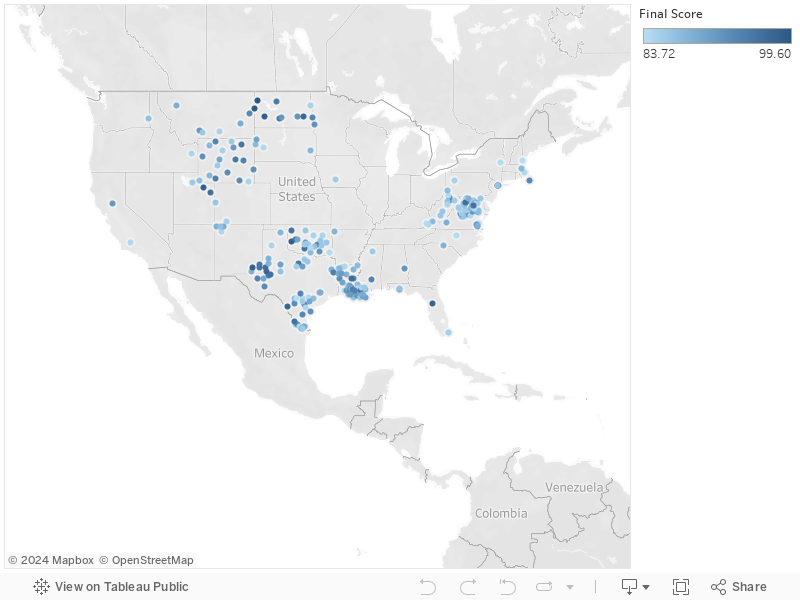
LendEDU set out to find the towns and cities in the U.S. that have seen the most economic growth since 2000 and are projected to continue that growth.
Using licensed data, we have analyzed over 25,000 U.S. towns and judged them on their household income growth from 2000 to 2017. Additionally, these places were also graded on their forecasted income growth over the next five years.
An original list of 25,000 was narrowed down to a list of the 250 U.S. towns that are seeing the fastest growth in household income.
We formulated our final rankings using a unique formula that factored in the following weighted parameters:
- Past Income Growth Score (35%, listed in table as Past Score)
- Forecasted Income Growth Score (65%, listed in table as Forecasted Score)
The U.S. cities and towns listed below have relished in economic opportunity and have been experiencing the fastest income growth in the 21st century.
Complete Rankings of the 250 Cities Where Household Incomes Are Rising the Fastest
Methodology
All data used in this study is under license from Onboard Informatics. Onboard Informatics’ dataset was used for the most recent population figures, location purposes, statistics on income growth from 2000 to 2017, and statistics on forecasted income growth over the next five years. In our original sheet, over 25,000 U.S. towns and cities were listed but that list was shortened because of our population cutoff. Any town or city with a population below 7,500 was immediately eliminated from further analysis.
Once a list was created that factored in the population requirements, we were able to move forward and pull the necessary statistics for each town and city in the U.S. Onboard Informatics’ dataset provides both income growth from 2000 to 2017 and forecasted income growth for the next five years as stand alone statistics. In other words, no manipulation to the data was necessary to get the data that was required for this study. After each town was matched with their income growth from 2000 to 2017 and their forecasted five year income growth, we were able to move forward with our unique equation.
Based on the range of scores that the towns received for both of the parameters used in this study, we were able to develop a range and an average score for each parameter. Each town was assigned a score on a 100 point scale for each of the parameters based on how their respective statistics for each parameter lined up against the average statistical score for each parameter. After each town was given a score for each parameter based on the average score for every town, we were able to assign that score another individual score based on the weights of each parameter. The first parameter, Past Income Growth, held a weight of 35%, so each town’s Past Income Growth score was multiplied by .35 and the number from that math was used. Additionally, the second parameter, Forecasted Income Growth Score, held a weight of 65%, so each town’s Forecasted Income Growth Score was multiplied by .65 and the number from that math was used.
Once this math was completed for every single town and city on the list, we were able to add up the two weighted scores to come up with a final score. The final score was simply the sum of each town’s weighted Past Income Growth Score and Forecasted Income Growth Score. Towns that had a higher total score were ranked higher on the list and vice versa. The 250 towns that recorded the highest scores were the towns that were featured on our list.
See more of LendEDU’s Research
About our contributors
-
 Written by Mike Brown
Mike Brown uses data from surveys and publicly available resources to identify emerging personal finance trends and tell unique stories.