Student Loans
Paying for school doesn’t have to be confusing. This guide covers everything you need to know about student loans. For students at any stage, from undergraduate and graduate to career training, we’ll help you find the right college school loan.

2026 student loan changes
Several major federal student loan changes take effect July 1, 2026 under the One Big Beautiful Bill Act (OBBBA). Here's what borrowers should know:
Grad PLUS loans eliminated
- New borrowers can no longer take out Grad PLUS program loans after July 1, 2026. Existing borrowers in qualifying programs may still access them under transitional rules.
Repayment plans consolidated
- Most income-driven plans (SAVE, PAYE, ICR) are being phased out for new borrowers and replaced by two options: a Standard Repayment plan and the new Repayment Assistance Plan (RAP).
New federal borrowing caps
- A $257,500 lifetime aggregate limit now applies to new federal student loan borrowers across undergraduate and graduate study.
Forgiven debt may be taxable
- Student loan forgiveness amounts may be treated as taxable income under updated federal rules.
Are student loans going to be forgiven in 2026?
No broad cancellation is in effect, but existing loan forgiveness programs remain available. Public Service Loan Forgiveness and Teacher Loan Forgiveness from the federal government remain tax-free under current IRS guidance. Balances forgiven under most income-driven repayment plans starting in 2026 will be treated as taxable income.
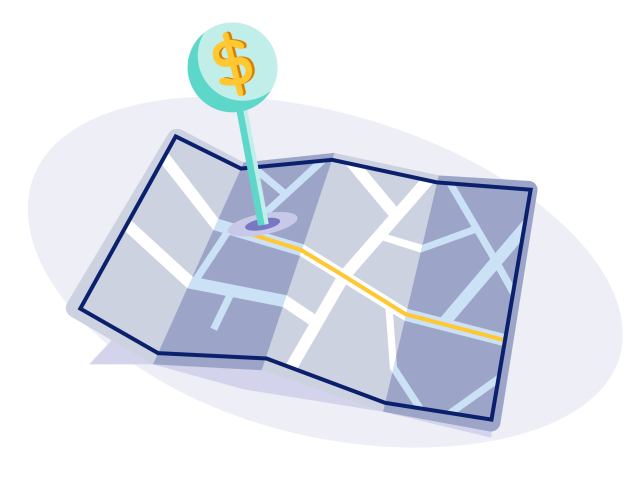
Take Out Student Loans
Whether you're an undergraduate, graduate student, or preparing for career training, we'll help you understand every step of the student loan process. Discover how federal and private loans work, how much you can borrow, and what to expect from different lenders before committing.
Start with the FAFSA to access federal aid before exploring private options. When federal funds fall short, LendEDU evaluates private lenders on rates, repayment flexibility, and borrower protections to help you find the best student loans for college.

FAFSA Guidance for Student Loans
FAFSA FAQ About Student Loans
Financial Aid Resources for Student Loans
Federal Loans and Private Student Loans
Federal student loans come from the US Department of Education and offer fixed interest rates, flexible repayment options, and access to programs like income-driven repayment and loan forgiveness. Most undergraduate education loans don't require a credit check, which makes federal aid the right starting point for most students.
Private student loans come from banks, credit unions, and online lenders. Rates and terms vary based on your credit history and the financial institution you choose, with both fixed and variable rates available. Private loans can fill the gap when federal aid won't cover higher education costs, but they typically come with fewer borrower protections.
Federal Student Loans Guidance
How Private Student Loans Work
Private Student Loan Lender Reviews
LendEDU's top-rated student loan lenders:
Other lenders:
Types of Private Student Loans
- Based on financial profile
- Based on institution
- Based on immigration status
- For non-traditional applicants
- Career training schools
- For parents
- For graduate students
- For health
Scholarships

LendEDU reviewed 725 data points from 25 lenders and financial institutions, with 29 data points collected from each.
Many or all companies we feature compensate us. Compensation and editorial research influence how products appear on a page.
Best Student Loan Lenders We Recommend
Here's a quick look at our top-rated student loan lenders. The tables below show key details for each, including fixed and variable APR ranges, minimum credit score requirements, and loan amounts, so you can compare offers side by side before applying.
Did you know? 96% of private undergraduate student loans have a cosigner.
Information advertised valid as of 07/20/2026. Variable interest rates may increase after consummation. Approved interest rate will depend on creditworthiness of the applicant(s).
All rates shown include the auto-pay discount. The 0.25% auto-pay interest rate reduction applies as long as a valid bank account is designated for required monthly payments. If a payment is returned, you will lose this benefit.
College Ave Student Loan Servicing, LLC, NMLS#1263410 NMLS Consumer Access
College Ave's student loan products are made available through Firstrust Bank, member FDIC, First Citizens Community Bank, member FDIC, or BTG Pactual Bank, N.A., member FDIC
Information advertised valid as of 7/24/2026
Borrow responsibly
We encourage students and families to start with savings, grants, scholarships, and federal student loans to pay for college. Evaluate all anticipated monthly loan payments, and how much the student expects to earn in the future, before considering a private student loan.
Loans for Undergraduate & Career Training Students are not intended for graduate students and are subject to credit approval, identity verification, signed loan documents, and school certification. Student must attend a participating school. Student or cosigner must meet the age of majority in their state of residence. Students who are not U.S. citizens or U.S. permanent residents must reside in the U.S., attend school in the U.S., and apply with a creditworthy cosigner (who must be a U.S. citizen or U.S. permanent resident). Requested loan amount must be at least $1,000.
1. Loan application must be submitted to see available rates.
2. Although we do not charge you a penalty or fee if you prepay your loan, any prepayment will be applied as provided in your promissory note — first to Unpaid Fees and costs, then to Unpaid Interest, and then to Current Principal.
3. Based on a comparison of the percentage of students who were approved with a cosigner to the percentage of students who were approved without a cosigner from October 1, 2023 to September 30, 2024.
4. The borrower or cosigner must enroll in auto debit through Sallie Mae to receive a 0.25 percentage point interest rate reduction benefit. This benefit applies only during active repayment for as long as the Current Amount Due or Designated Amount is successfully withdrawn from the authorized bank account each month. It may be suspended during forbearance or deferment.
5. Advertised APRs for undergraduate students assume a $10,000 loan with a 4-year in-school period, a 6-month grace, and the longest loan term offered. Interest rates for variable rate loans may increase or decrease over the life of the loan based on changes to the 30-day Average Secured Overnight Financing Rate (SOFR) rounded up to the nearest one-eighth of one percent. Advertised variable rates are the starting range of rates and may vary outside of that range over the life of the loan. Interest is charged starting when funds are sent to the school. With the Fixed and Deferred Repayment Options, the interest rate is higher than with the Interest Repayment Option and Unpaid Interest is added to the loan’s Current Principal at the end of the grace/separation period. To receive a 0.25 percentage point interest rate discount, the borrower or cosigner must enroll in auto debit through Sallie Mae. The discount applies only during active repayment for as long as the Current Amount Due or Designated Amount is successfully withdrawn from the authorized bank account each month. It may be suspended during forbearance or deferment.
6. Savings comparison assumes a freshman student receives a $10,000 Smart Option Student Loan with the most common variable rate as of January 2025 and the longest loan term offered.
7. Examples of typical transactions for a $10,000 Smart Option Student Loan with the most common fixed rate, Fixed Repayment Option, two disbursements, a 4-year in-school period, and a 6-month grace: For a borrower with the shortest loan term, it works out to 16.16% fixed APR, 51 payments of $25.00, 119 payments of $296.32 and one payment of $41.82, for a total loan cost of $36,578.90. For a borrower with the longest loan term, it works out to 16.38% fixed APR, 51 payments of $25.00, 177 payments of $265.54 and one payment of $173.00, for a total loan cost of $48,448.58. Loans that are subject to a $50 minimum principal and interest payment amount may receive a loan term that is less than 10 years. A variable APR may increase over the life of the loan. A fixed APR will not.
SALLIE MAE RESERVES THE RIGHT TO MODIFY OR DISCONTINUE PRODUCTS, SERVICES, AND BENEFITS AT ANY TIME WITHOUT NOTICE. CHECK SALLIEMAE.COM FOR THE MOST UP-TO-DATE PRODUCT INFORMATION.
Sallie Mae loans are made by Sallie Mae Bank.
Ascent's undergraduate and graduate student loans are funded by Bank of Lake Mills or DR Bank, each Member FDIC. Loan products may not be available in certain jurisdictions. Certain restrictions, limitations, terms and conditions may apply for Ascent's Terms and Conditions please visit AscentFunding.com/Ts&Cs.
Annual Percentage Rates (APRs) displayed are effective as of 07/21/2026 and reflect an Automatic Payment Discount (ACH). The ACH discount consists of 0.25% on credit-based college student loans submitted prior to 6/1/2025, a 0.5% discount for on credit-based college student loans submitted on or after 6/1/2025 and a 1.00% discount on outcomes-based loans when you enroll in automatic payments. Loans subject to individual approval, restrictions, and conditions apply. Loan features and information advertised are intended for college student loans and are subject to change at any time.
The final amount approved depends on the borrower's credit history, verifiable cost of attendance as certified by an eligible school and is subject to credit approval and verification of application information. Lowest interest rates require full principal and interest (Immediate) payments, the shortest loan term, a cosigner, and are only available for our most creditworthy applicants and cosigners with the highest average credit scores. Actual APR offered may be higher or lower than the examples above, based on the amount of time you spend in school and any grace period you have before repayment begins. Variable rates may increase after consummation. 1% Cash Back Graduation Reward subject to terms and conditions. For details on Ascent borrower benefits, visit AscentFunding.com/
The following examples for a $10,000 loan show a 48-month in-school period plus 9 months of grace prior to a full repayment term for 60-months (variable rate), with examples of (i) Interest Only payments, (ii) $25 Minimum payments, (iii) Deferred repayment, and (iv) Immediate Repayment options.
* Interest Only Repayment: 5.85% APR, with 57 payments of $48.75 while in-school/grace, 60 payments of $192.65 during the repayment term, and a total cost of $14,338.61.
* $25 Minimum Payment: 6.48% APR, with 57 payments of $25.00 while in-school/grace, 60 payments of $233.37 during the repayment term, and a total cost of $15,427.06.
* Deferred Repayment: 6.67% APR, with no payment while in-school/grace, 60 payments of $269.21 during the repayment term, and a total cost of $16,137.16.
* Immediate Repayment: 3.60% APR, with 60 payments of $182.37, and a total cost of $10,942.30.
The following examples for a $10,000 loan show a 48-month in-school period plus 9 months of grace prior to a full repayment term for 180-months (highest variable rate), with examples of (i) Interest Only payments, (ii) $25 Minimum payments, (iii) Deferred repayment, and (iv) Immediate Repayment options.
* Interest Only Repayment: 16.26% APR, with 57 payments of $135.42 while in-school/grace, 180 payments of $148.66 during the repayment term, and a total cost of $34,476.99.
* $25 Minimum Payment: 15.03% APR, with 57 payments of $25.00 while in-school/grace, 180 payments of $256.16 during the repayment term, and a total cost of $47,530.48.
* Deferred Repayment: 15.23% APR, with no payment while in-school/grace, 180 payments of $290.4 during the repayment term, and a total cost of $51,470.36.
* Immediate Repayment: 16.01% APR, with 180 payments of $146.93, and a total cost of $26,445.92.
Repay Your Student Loans
Federal borrowers have several paths forward, including income-driven plans, standard repayment, and Public Service Loan Forgiveness for qualifying public service workers. Starting in 2026, new federal borrowers will choose between the Standard Repayment Plan and the new Repayment Assistance Plan (RAP). Private loan repayment is set by your lender and rarely includes income-driven options.
Learn about repayment plans, forgiveness options, solutions for delinquent and defaulted student loans, and strategies to stay on track with repayment and get out of debt faster.
Plan Your Student Loan Payoff Strategy
- How to Pay Off $100K in Student Loans in 6 Steps
- How Long Will It Take to Pay Off Student Loans? Timelines for $10K – $200K
- How to Pay Off Student Loans Fast: 12 Strategies to Become Debt-Free Sooner
- How to Calculate Your Minimum Student Loan Payment
- Can You Make Principal-Only Payments on Student Loans?
- What "Do Not Advance Due Date" Means for Student Loan Repayment
- Student Loan Payments Too High? 7 Strategies to Lower or Pause Them
- Can You Pay Student Loans Off Early? What to Know Before You Decide
- 10 Reasons Your Student Loan Payment Increased (and What to Do About It)
- Student Loan Repayment Plan Denied? What to Know
Navigating Student Loan Repayment Options and Plans
Delinquency and Default Consequences for Student Loans
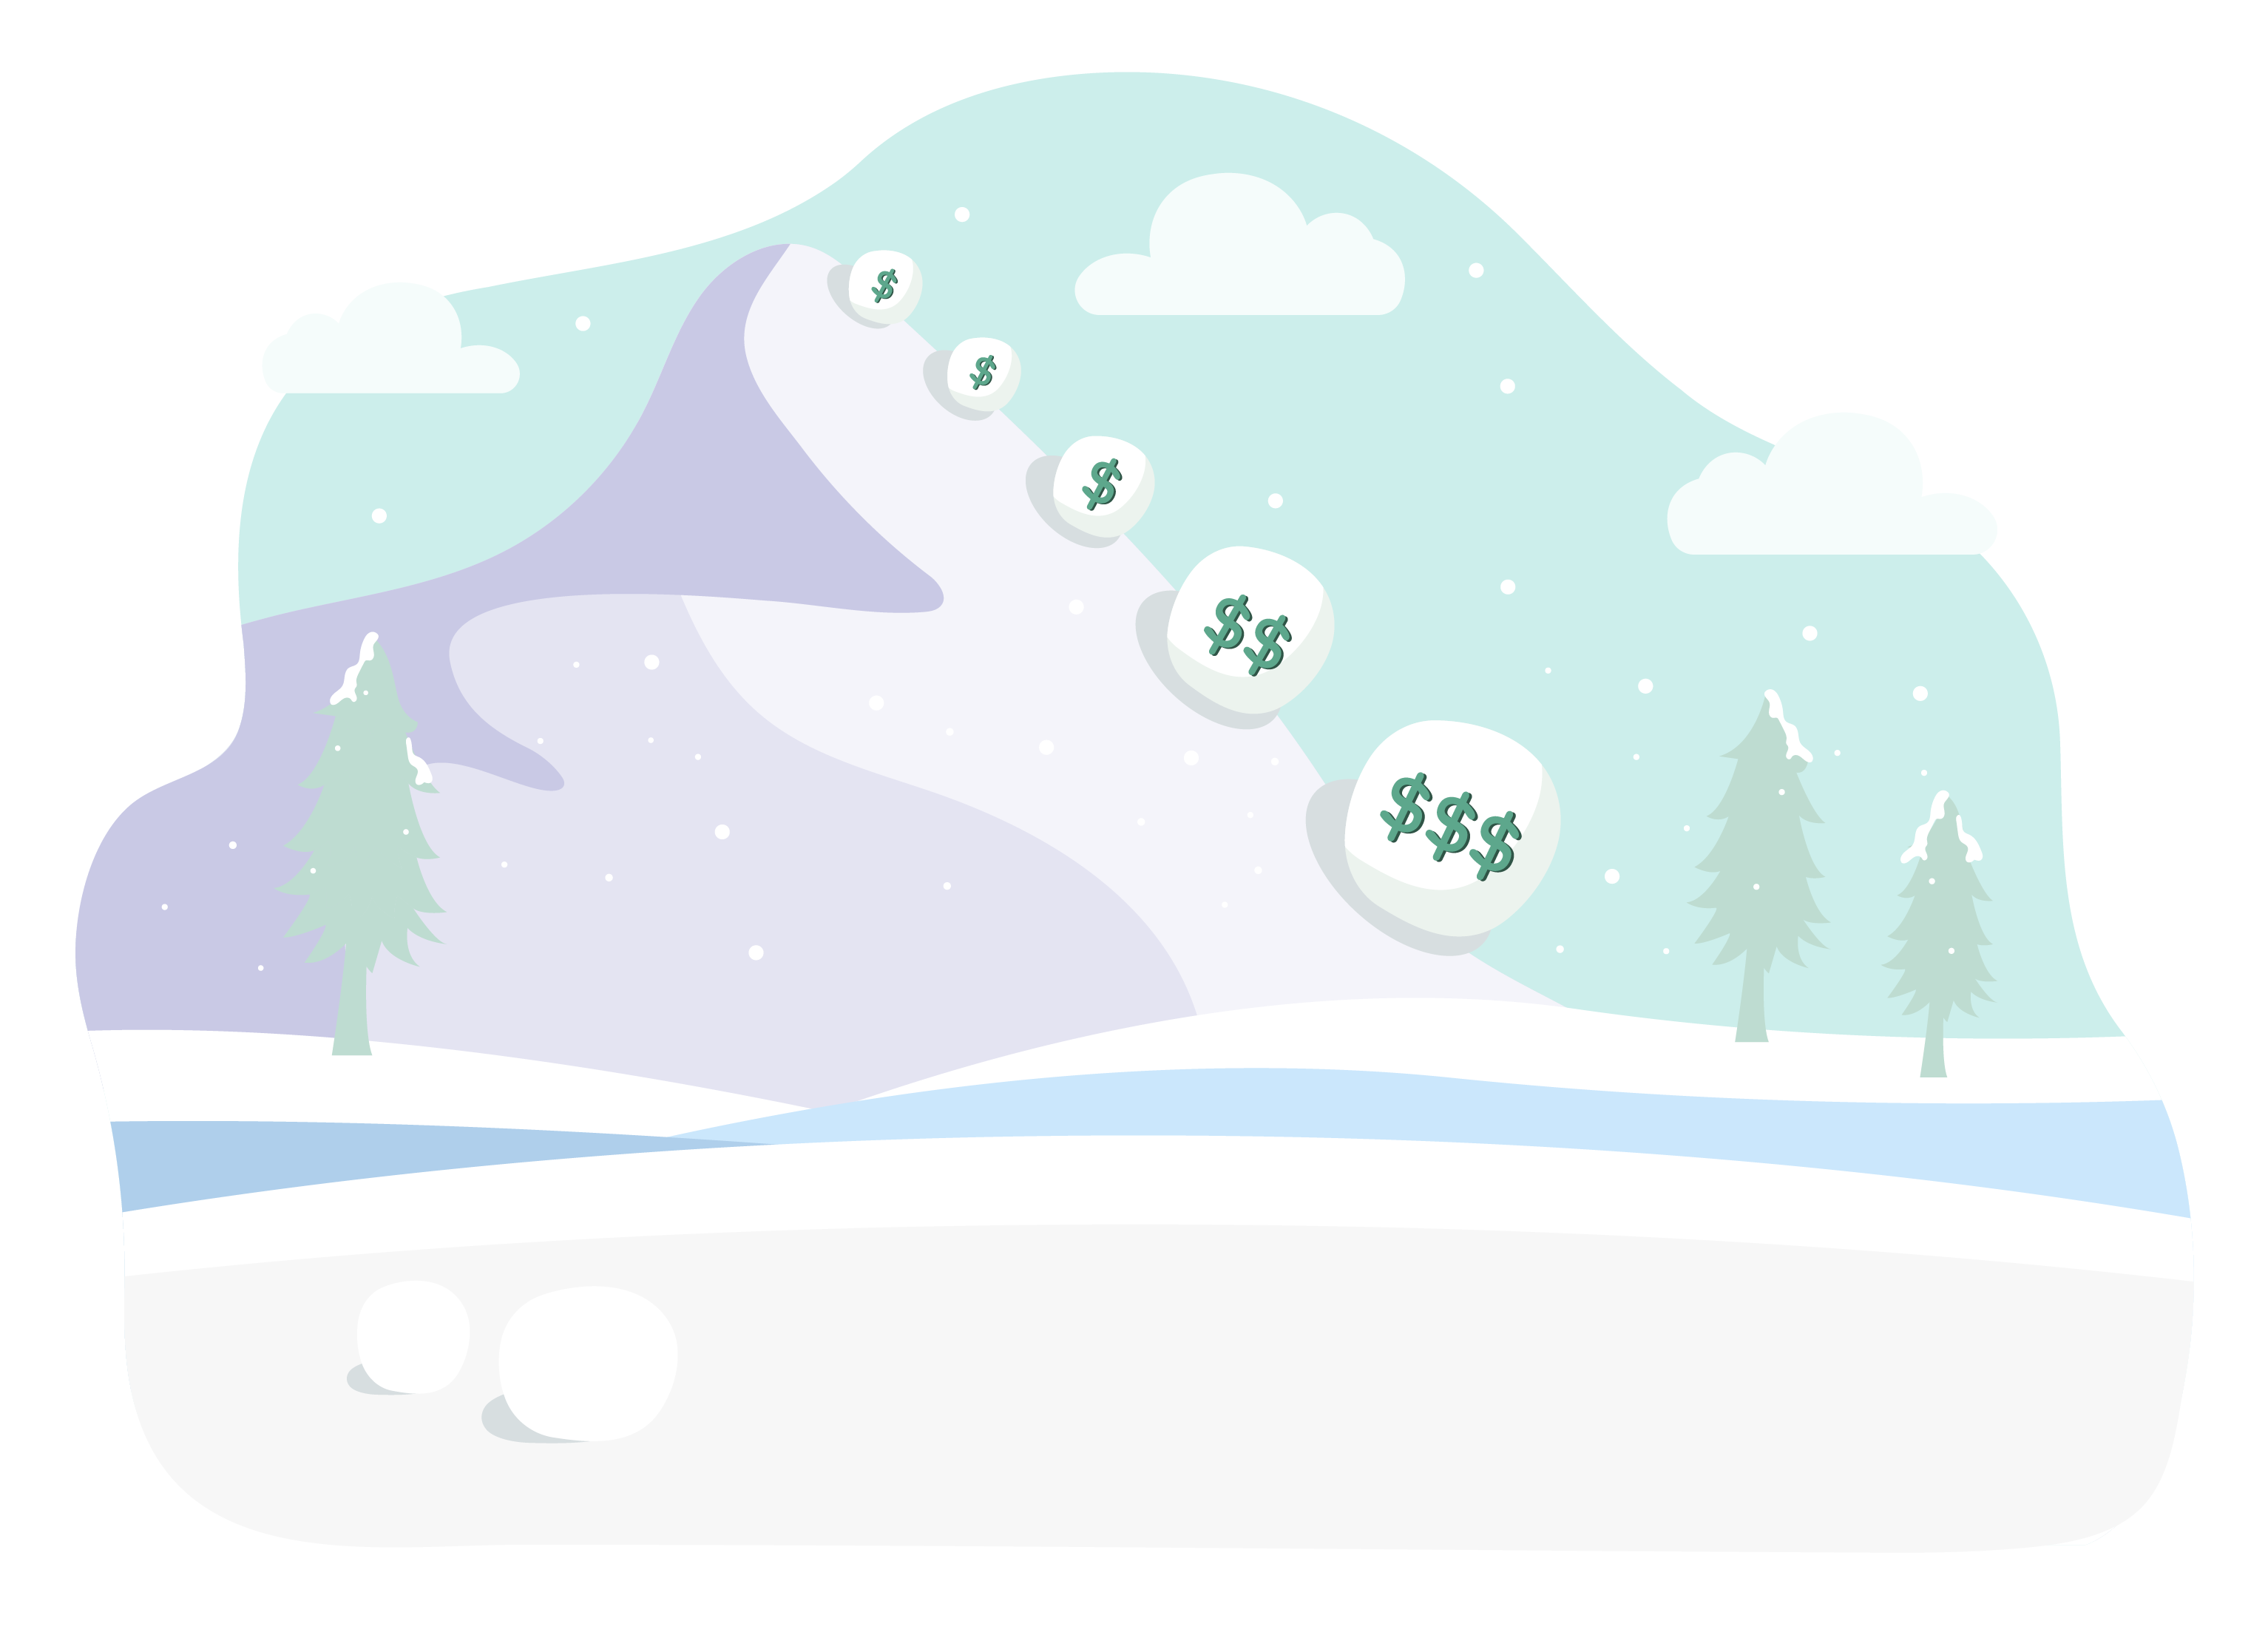
Refinance Your Student Loans
Refinancing replaces one or more existing student loans with a new private loan, usually to secure a lower interest rate or roll multiple monthly payment obligations into one. Federal borrowers should carefully weigh giving up income-driven repayment eligibility and other federal protections before making the switch.
Looking to save on interest or simplify your payments? Refinancing could be the solution. Learn how refinancing works, when it makes sense, and which lenders offer the most competitive rates.
How Student Loan Refinance Works
Student Loan Lender Reviews
Student Loan Lender Roundups and Comparisons
Refinance Options Based on Your Student Loan Type
LendEDU reviewed 696 data points from 24 lenders and financial institutions, with 29 data points collected from each.
Many or all companies we feature compensate us. Compensation and editorial research influence how products appear on a page.
Best Student Loans Lenders We Recommend for Refinancing
Below are our top-rated lenders for student loan refinancing. Compare fixed and variable APR ranges, repayment term lengths in years, and minimum refinance amounts to find the lender that matches your balance and payoff timeline.

All student loan articles
-

12 Tips to Pay for College Without Parents’ Help
Paying for college is no easy task. Learn about the steps you should take and find resources that can help you along the way.
-

13 Mental Health Scholarships to Apply for in 2026
Mental illnesses are hard to handle, but dealing with them in college is even more stressful. Fortunately, there are scholarships for people with mental illness that can help you reduce…
-

2025 – 2026 FAFSA Requirements: Documents, Eligibility, and What’s New
Filling out the Free Application for Federal Student Aid (FAFSA) is the first step to accessing federal financial aid for college or career school. The U.S. Department of Education uses…
-

2025 – 2026 Limits on Federal Student Loan Amounts Per Year
Students can’t borrow an unlimited amount in federal student loans. Limits apply based on financial aid they receive, their dependency status, and other factors.
-

2026 Guide to MEFA Loans: What to Know About Its Student Loans and Refinance
MEFA (the Massachusetts Educational Financing Authority) might sound like it’s just for students in Massachusetts—but its student loans and refinancing options are available nationwide. Known for no fees, fixed interest…
-
2026 Review: American Education Services (AES) Private and Federal Student Loan Servicer
AES is one of the nation’s largest student loan servicers, serving over four million student loan accounts. Though it’s assumed many student borrowers have positive experiences with AES, over the…
-

2026 Student Loan Legislation Forecast: What Borrowers Should Know
This year is shaping up to be a defining year for student loan reform, with significant developments in student loan legislation. Between high-profile court actions and sweeping reconciliation proposals, borrowers…
-

2026 Yrefy Review: The Best Refinance Option for Private Loan Borrowers in Default
Yrefy is a one-of-a-kind refinance option for borrowers in default on private loans. You don’t need to meet a minimum credit score or income requirement to qualify for the loans.…
-

3 Best No- or Low-Credit Student Loans in 2026 and How to Qualify
Most private lenders want a credit score in the mid-600s, and most students aren’t there yet. Fortunately, federal student loans without a credit check exist. There is a small group…
-

36 Weird Scholarships
If you think scholarships are just for outstanding athletes and brilliant students with a 4.0 GPA, you could be missing out on thousands of dollars for your college education. Weird scholarships…