When purchasing a new home, it’s crucial to consider if you will be able to afford your monthly payments and how your finances will be affected as a whole.
If your mortgage payments aren’t affordable, you may not have the money you need for saving, investing, spending, or other financial goals.
To help consumers understand which areas of the United States have the most and least affordable homes, we gathered and analyzed data from the U.S. Census Bureau and the Harvard Joint Center for Housing Studies.
Below you will find rankings of metropolitan areas by the highest to lowest percentage of homes that are affordable for the typical household living there. We also broke down the ratings by region and division of the U.S.
Homes were considered to be affordable if the required monthly mortgage payment was less than 31% of the median monthly household income for that area.
You can learn more about these rankings in the Methodology section at the bottom of this page.
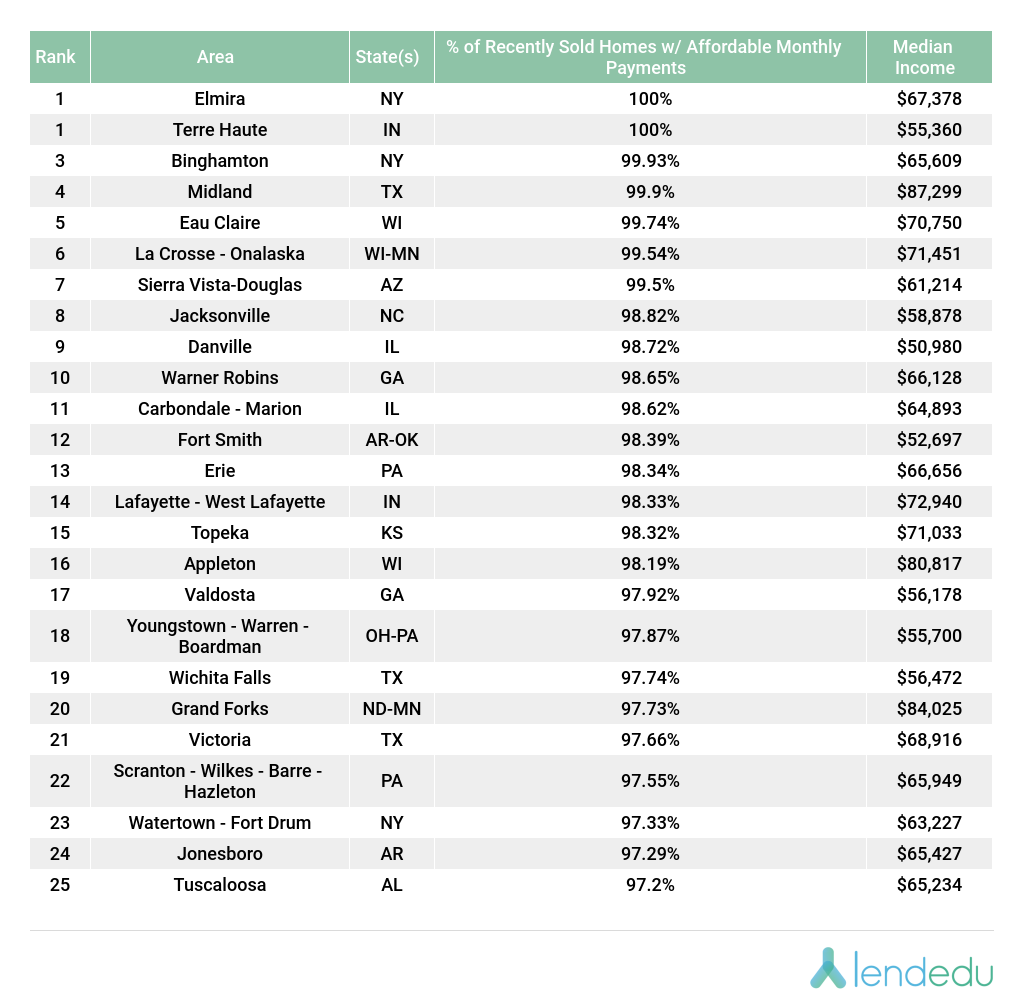
Areas with the Most & Least Affordable Homes
First, we took a look at which metropolitan areas have the highest and lowest proportions of affordable homes. Note that some of these areas span across multiple cities and states.
Regional Divisions with the Most & Least Affordable Homes
Next, we analyzed the percentage of affordable homes by regional divisions of the United States. The areas in each division were weighted by their population to ensure they contributed proportionally to the final figure.
Click here to see a breakdown of which states were included in each division.
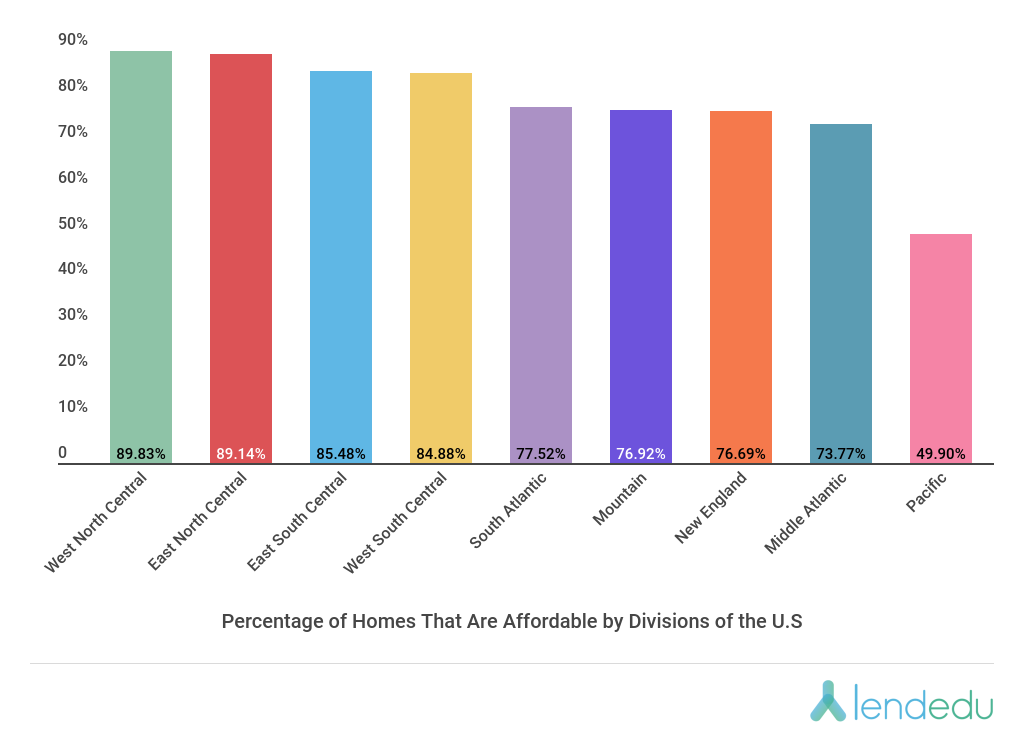
The Pacific division had the lowest proportion of affordable homes in the U.S. by a staggering amount. This area is largely made up by California—which includes notoriously costly cities such as San Francisco, Los Angeles, and San Jose—as well as other expensive cities including Honolulu (HI), Bend (OR), and Medford (OR).
On the flip side, the West North Central division had the highest proportion of affordable homes, with nearly 90% meeting the criteria. This is not surprising as this division includes many states with the low costs of living, including Kansas, Missouri, Iowa, and Nebraska.
Regions with the Most & Least Affordable Homes
Finally, we analyzed the percentage of affordable homes in the four major regions of the United States. Each metropolitan area was weighted by its population to ensure it contributed proportionally to the final figure.
Click here to see a breakdown of which states were included in each region.
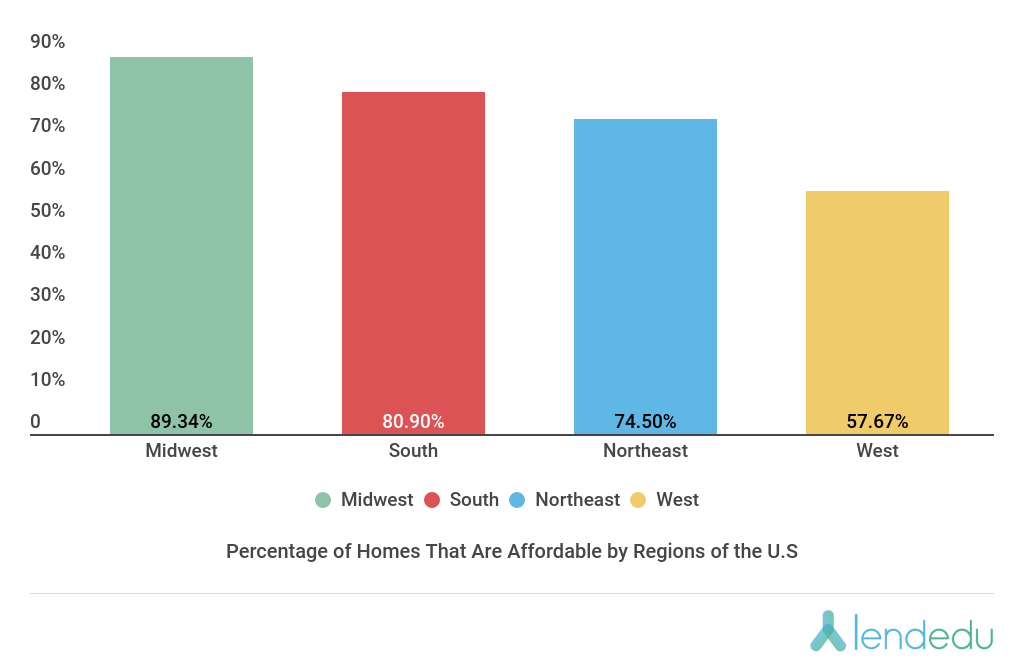
As expected after seeing the divisional breakdown, the West region had the lowest proportion of affordable homes. On top of the expensive areas in the Pacific region, the Mountain division includes some metro areas with the least affordable homes including Logan and St. George in Utah as well as Prescott, Arizona and Boulder, New Mexico.
Similarly, the region with the highest proportion of affordable homes also included the most affordable division. Aside from the West North Central states, the Midwest region also includes the East North Central states which include many affordable cities such as Topeka, Kansas; Grand Forks, North Dakota; and Cedar Rapids, Iowa.
Tips to Keep Your Mortgage Affordable
If you have taken out a mortgage to become a homeowner, there are a few strategies that may help you keep the monthly mortgage payments affordable.
LendEDU details some of these strategies below.
Create a Budget Right From the Start
This strategy should be implemented before you even take out a mortgage. You should always set a mortgage budget right at the beginning of your house hunt so that you don’t break the bank trying to become a homeowner.
LendEDU has a mortgage calculator that allows you to estimate monthly mortgage payments depending on the size of the home loan, the interest rate, and the term length.
Leave No Stone Unturned
When you have set your budget, the next thing you should do is compare all of your mortgage options. This means comparing the various mortgage lenders, from VA home loan lenders to online mortgage lenders.
This also means brushing up on your knowledge of current mortgage interest rates, from 30-year mortgage rates to VA mortgage rates so that you know what the current market is looking like.
Look Into Refinancing in the Future
Finally, it’s usually a good idea to at least consider a mortgage refinance after you have demonstrated a history of successful mortgage repayment.
The mortgage refinance calculator at LendEDU should help paint you a clearer picture in terms of what refinancing your home loan could potentially mean for your wallet.
Methodology
All of the data presented in this report came from the Harvard Joint Center for Housing Studies’ The State of the Nation’s Housing 2019 report—which included data from the U.S. Census Bureau’s 2017 American Community Survey and Freddie Mac’s Primary Mortgage Market Survey—as well as the U.S. Census Bureau’s County and Metro Area Population Estimates report.
Only homes purchased within 12 months prior to the U.S. Census Bureau survey date were included in the study. In addition, the median income data used in this report is for households that own their homes; renters are excluded.
Rankings are based off the percentage of homes in an area that required monthly payments deemed affordable—as defined by requiring less than 31% of monthly household income—to a household making the median household income for that area.
Monthly mortgage payments assumed a 3.5% downpayment, property insurance of 0.35%, mortgage insurance of 0.85%, and property taxes of 1.15%.
For the regional and divisional analyses, each metropolitan area was weighted according to its population estimate by the U.S. Census Bureau. This ensured that metro areas with higher and lower populations contributed proportionally to the final figure.
Regions and divisions of the U.S. were used according to the U.S. Census Bureau and are defined as follows:
- Northeast
- New England: Connecticut, Maine, Massachusetts, New Hampshire, Rhode Island, and Vermont
- Mid-Atlantic: New Jersey, New York, and Pennsylvania
- Midwest
- East North Central: Illinois, Indiana, Michigan, Ohio, and Wisconsin
- West North Central: Iowa, Kansas, Minnesota, Missouri, Nebraska, North Dakota, and South Dakota
- South
- South Atlantic: Delaware, Florida, Georgia, Maryland, North Carolina, South Carolina, Virginia, Washington D.C., and West Virginia
- East South Central: Alabama, Kentucky, Mississippi, and Tennessee
- West South Central: Arkansas, Louisiana, Oklahoma, and Texas
- West
- Mountain: Arizona, Colorado, Idaho, Montana, Nevada, New Mexico, Utah, and Wyoming
- Pacific: Alaska, California, Hawaii, Oregon, and Washington
See more of LendEDU’s Research
About our contributors
-
 Written by Dave Rathmanner
Dave Rathmanner has researched and developed content on a variety of finance topics, such as student loans, personal loans, credit cards, and small business loans.