Ohio takes its name from the Ohio River, the major geographic feature of the famous Ohio River Valley. The enormous river valley, and later the state of Ohio, was “gifted” to the British Empire after victory over the French in the Seven Years War. A couple decades and a revolution later, the same river valley changed hands to the newly formed United States.
Before and after the American Revolution, however, the Western settlement of the Ohio area had been in full swing. Colonials and later, Americans, streamed into the river valley in increasing numbers.
By the end of nineteenth century, Ohio became one of the most industrialized areas in North America. This development led to mass migrations towards the state, and today, Ohio is ranked within the top ten most populous states in the United States.
Home to over 11 million people, Ohio boasts nearly 5 million households within its state borders. About 90 percent of the population graduated high school, and a quarter of the population holds a bachelor’s degree. With decent family sizes, plenty of housing, and an 85 percent resident retention rate, it remains clear that Ohio is a solid place to buy a home and start a family.
Here at LendEDU, we wanted to analyze the state of Ohio and its home buying environment. Using a unique ranking formula, we looked at the best places to buy a home in the state of Ohio. Read on to learn a bit more about The Buckeye State and the best home buying communities within the state.
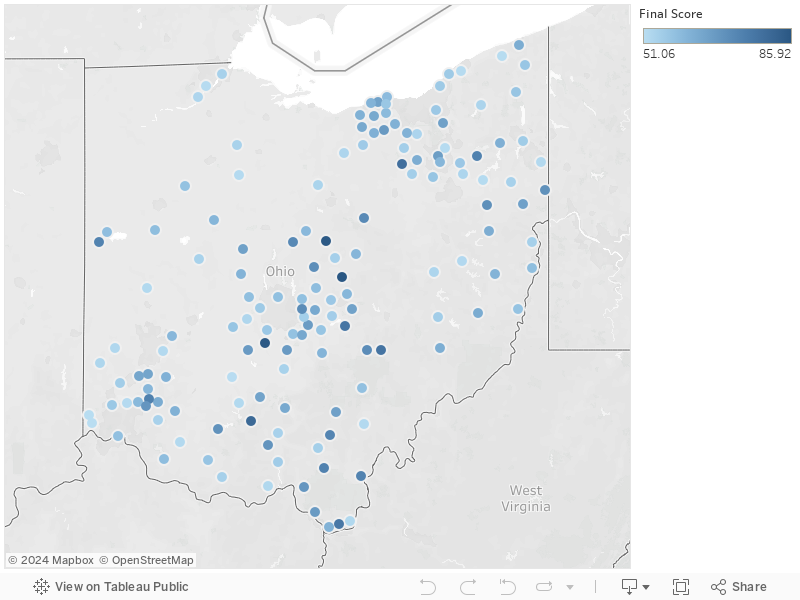
Top 150 Cities in Ohio for Homebuyers
Methodology
All data was from Onboard Informatics, covering city level statistics broken out by zip code. Overall, over 900 locations in Ohio were broken out by city name, county name, and population along with several pieces of data that will be mentioned later.
Before processing metrics for these locations, a population cutoff of 2,000 was used to phase out lower population areas. After this, there were 337 Ohioan locations left. When processing was over, only 150 were left.
When processing the data, several scoring metrics were calculating using the city-level data. Each of these scoring metrics were weighted by importance and summed together to find the final score of a city. The final score was used as the ranking metric. More on the scoring metrics:
Population Score (40-point weight)
The population score refers to the percent change in population over five years. If a city or town projected a larger change in population, it was more likely to score higher. This was viewed as a positive indicator that citizens were moving to the area making it a desirable place to live in.
For a location, Onboard provided current population levels as well as projected population figures in five years. A simple percent change equation between this projected population and current population was used to determine the percent change in population over five years. Each locations percent change in population was ranked on a percent scale of 0 to 100, and each percent rank was multiplied by a weight of 40 points.
Income Score (20-point weight)
The income score was determined in the same exact way as the population score. Instead of population, median household income, both current and projected in five years, was used in the percent change equation. It was believed that greater incoming household earning value was a positive indicator, so locations with greater percent changes were more likely to rank higher than others. The income percent rank was multiplied by a weight of 20 points to find the percent score.
Value Score (40-point weight)
Value scores were determined with a calculation using the median home sale value and median household income. Quite simply, the ratio of income to value was used for this scoring metric. If an area had a higher ratio, that meant residents were earning more annually compared to home value. This metric was viewed as a useful gauge of earning potential against the main buy-in expense for moving to an area. Areas with higher value ratios were more likely to rank higher. Each location’s value score was ranked against the field on a percent scale of 0 to 100. These percent ranks were all multiplied by a weight of 40 points to determine the final value score.
See more of LendEDU’s Research
About our contributors
-
 Written by Andrew Rombach
Fresh out of college, Andrew Rombach started freelance writing and editing in personal finance to help pay bills and student debt. He developed an interest in personal finance as he explored tips and tricks for managing credit cards, student loans, and more.